
Analyzing the contribution of input descriptors on simulation outputs with a tornado plot
The end goal is to assess the contribution of input descriptors on a given quantities of interest (QOI) and get a direction of this contribution. The contributions are computed for some quantities of interest with respect to some input descriptors.
To analyze the contribution of input descriptors on simulation outputs, you first need a Trial Visualization. The third tab corresponds to the Contribution Analysis.
To visualize your results, you can:
- Select outputs: you can decide to output a visualization for any clinical measure defined in the measure design attached to the trial. Click on the button ‘Update Results’ to display / update results on the plots.
- Filter results: you have the possibility using the Filtering options on the left-side panel to apply filters on baseline descriptors, patients descriptors and scorings.
- Group results: by default, all results will be grouped by arm. You can also apply various groupings, using distinct values, span, buckets, and quantiles.
- Select baseline descriptors: the contribution analysis will be computed with respect to the selected baseline descriptors. Two selection are available:
- InputBaselineOnly : this will only select the input descriptors, that correspond to the scalar inputs of the model.
- AllBaseline: this will select both input and formulaic descriptors. They are all the descriptors known at the start of or a clinical trial.
Analysis methodology
Contribution analysis is based on the comparison of statistical properties of subgroups of the Vpop versus properties of the whole Vpop.
To compute one contribution analysis for a quantity of interest, the following process is applied:
- we compute the median of the quantity of interest among the patients (noted medianValue)
- for each input descriptor :
- patients are sorted by increasing order of input descriptor value
- the population is split in two subpopulations: the first half (low bucket) and the second half(high bucket) of the distribution.
- for each bucket, we compute the median of the quantity of interest among the patients of the bucket. This provides lowMedianValue and highMedianValue.
- then we compute the relative contribution of the descriptor by calculating
andlowMedianValue - medianValue / absolute(medianValue)highMedianValue - medianValue / absolute(medianValue) - we center the Tornado graph on |MedianValue| and the bars around corresponds to the relative lowMedianValue and highMedianValue. The input descriptors are sorted by descending order of | lowMedianValue + highMedianValue |
Example
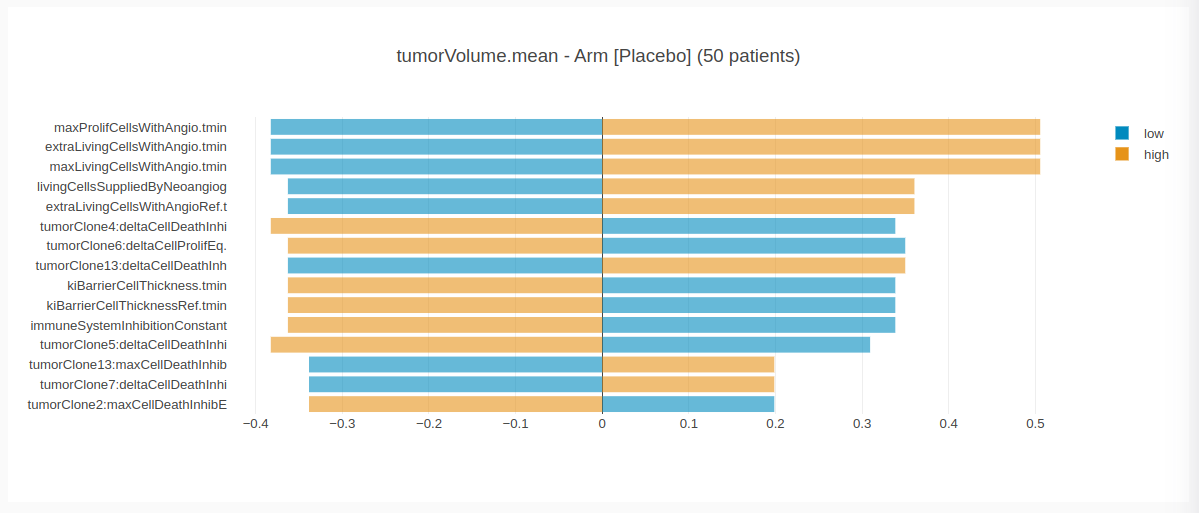
What we can observe is that extraLivingCellsWithAngio, maxLivingCellsWithAngio and maxProfilCellsWithAngio have the highest contribution on the tumorVolume.mean among patients in the control arm. We can also see that the those descriptors and the tumorVolume.mean are positively correlated: the subpopulation containing the 50% of highest value for extraLivingCellsWithAngio has a median for tumorVolume.mean 51% higher than in the overall population.
Another contribution analysis use case with its interpretation can be found in this question asked by the community.
Reply
Content aside
-
1
Likes
- 2 yrs agoLast active
- 171Views
-
1
Following